
Introduction
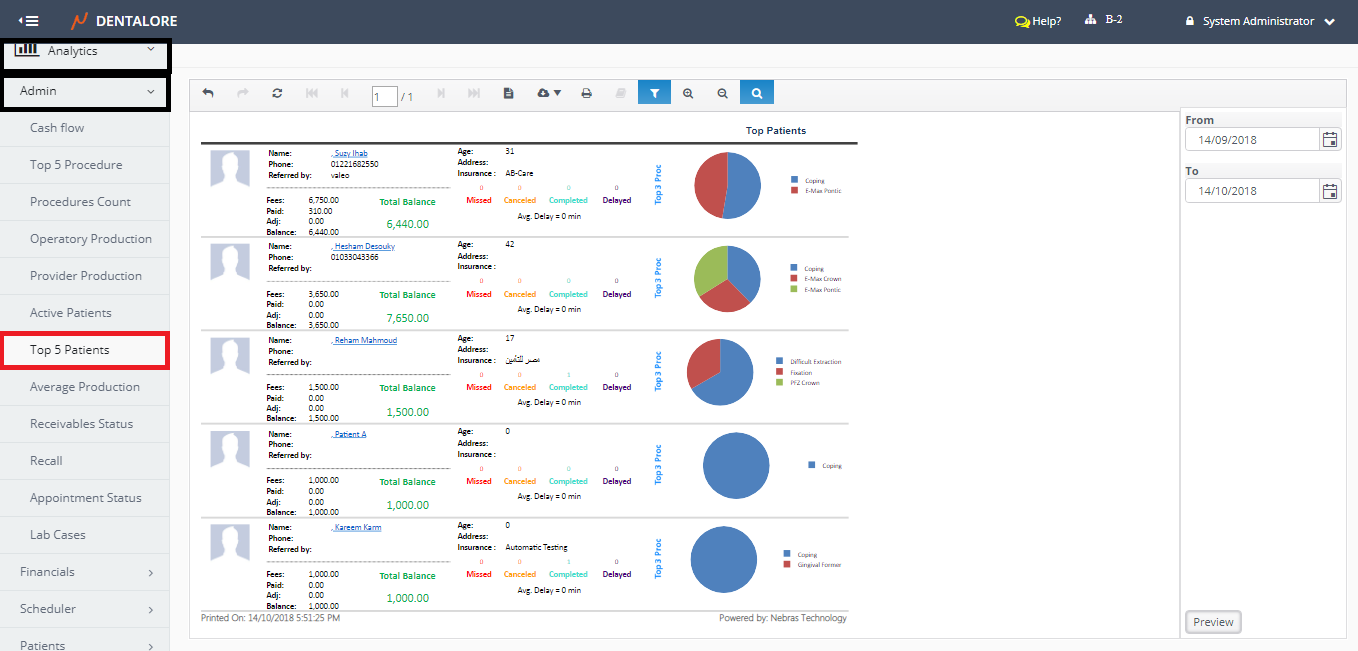
Top 5 Patients Report:
- Displays the Top 5 Patients All over the Clinic (In All Branches) within a selected date range.
- Patients listed in the report are ranked according to the highest Fees that patient who has the largest total balance will be displayed first.
(Top 5 Patients) report could be accessed from:
- Analytics >> Admin >> Top 5 Patients.
Filtration
User has the ability to filter data within required period of time from:
- Date Range
- (From) and (To) fields in the filtration Area.
Content
Top 5 Patients displays the following data for each of patient:
1- Patient's Personal Information
- Photo
- Name
- Note that the patient's name is clickable link that once pressed user will be directed to the 'Edit Patient' page. - Age
- Address
- Phone
- Referred by
- Is the source from where the patient knows about the clinic and it's selected from patient's info page. - Insurance
- Is the name of insurance company that the patient related to "If patient has insurance".
2- Patient's Ledger Information
- This Section displays the patient's ledger for all procedure status (Planned, In Progress and Completed) within the selected date range.
- Fees
- Field displays the Total Fees of patient on all of his/her procedures within the selected date range. - Paid
- Field displays the Total Payments (Patient + Insurance) for all procedures within the selected date range. - Adj
- Field displays the Total Adjustments (Patient + Insurance) for all procedures within the selected date range. - Balance
- Field displays the patient's balance 'Remained Amount' on both of the patient and Insurance for all procedures within the selected date range. - Total Balance
- Field displays the Total balance for (Patient + Insurance) that should be paid before the selected date range + his/ her balance within the date range.
3- Patient's Visits Information
- Missed
- Displays the Total number of Missed visits within the selected date range. - Cancelled
- Displays the Total number of Cancelled visits within the selected date range. - Completed
- Displays the Total number of Completed visits within the selected date range. - Delayed
- Displays the Total number of Delayed visits within the selected date range. - Avg. Delay
- Displays the time (In Min.s) that patient has delayed on the visit.
- Average Delay is the Summation of all delayed time / number of delayed visits.
- Note that this delayed time is not related to the visit of status (delayed) in which:
-> Total Delay Minutes= Check in time - Reservation time
4- Patient's Procedures
- This Section displays the patient's Procedures for all status (Planned, In Progress and Completed) within the selected date range.
- Pie Chart displays 3 Procedures for each patient in which these procedures are ranked according to the largest Fees.