
Introduction
Recall Report:
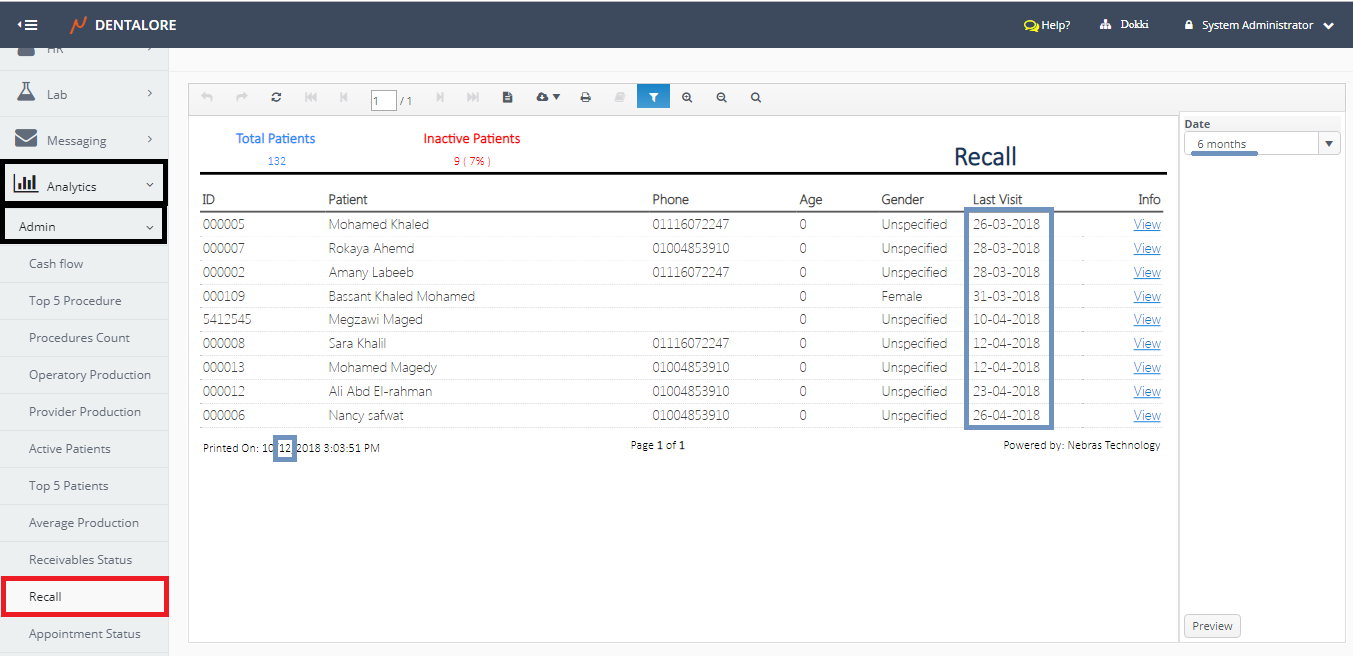
- Displays the patients who have at least one completed visit since long time, starting from 6 months ago (Period could be selected from filtration area) and didn’t come again to the clinic or didn’t finish their next visits.
- Data displayed in report are for all clinics’ branches (Per Clinic).
(Recall) report could be accessed from:
- Analytics >> Admin >> Recall.
Filtration
User has the ability to filter data within required period of time from:
- Date
- Is a Drop down menu that contains different periods of time to select from them which are: 6 Months, 9 Months, 12 Months, 15 Months, 18 Months, 21 Months, and 24 Months.
- Default Selection is: 6 Months.
Content
Header
At the report’s header the following values are displayed:
– Label (Total Patients): Displays the total count of patients in your clinic for all branches.
– Label (Inactive Patients): Displays the total count in number and percentage for patients who have at least one completed visit before the selected date range.
-> N.B.: The total count of inactive patients is the count of patients displayed in the report. And the Percentage is calculated based on the total count of all patients exist in the clinic.
Body
Patient’s data are displayed in a grid view whose columns are:
- ID
- Patient
- Phone
- Age
- Gender
- Last Visit
- Displays the date and time of the patient’s Last Completed Visit. - Info
- Is a clickable field (View) that once pressed; a new tab opens directing user to the “Edit Information” page of the selected patient.