
Introduction
Provider Production Report:
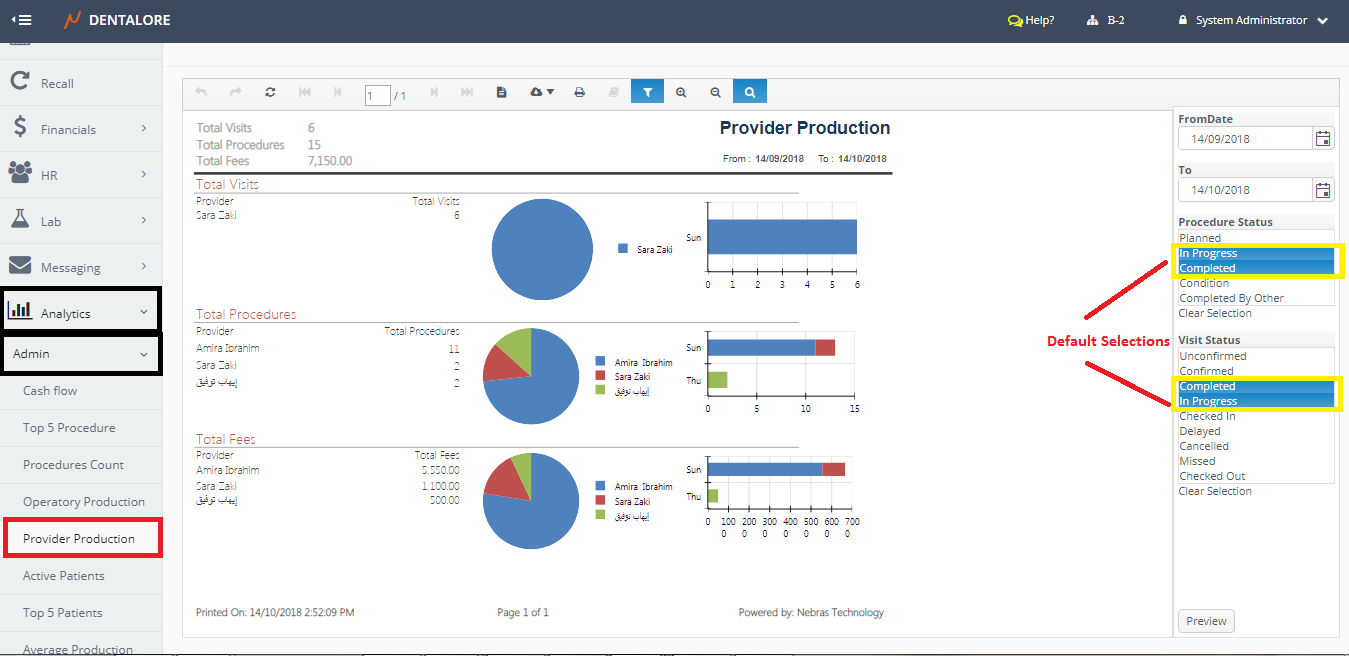
- Displays the provider's production within a selected date range for each of the Total Visits, Total Procedures and Total Fees each in a separated section.
- Displays Data over the Last Month by default.
- Data in the reports' sections are displayed in a Descending order.
- The total value for each of visits, Procedures and Fees are displayed at the report's header.
(Provider Production) report could be accessed from:
- Analytics >> Admin >> Provider Production.
Filtration
User has the ability to filter data using any of the following fields in the filtration Area:
- Date Range
- (From) and (To) fields enables user to select the required date range.
- Date filtration depends on the Creation Date of procedure in the (Procedure) and (Fees) sections, also depends on the Creation Date of visit in (Visits) section within the selected date range.
- Default Selection: Last Month from today's date. - Procedure Status
- Is a multi-selection box contains all of the avaliable status of procedure to select required status/es.
- Default selection: In Progress and Completed.
-- N.B.: This filtration affects the (Total Procedures) section in Report. - Visits Status
- Is a multi-selection box contains all of the avaliable status of visit to select required status/es.
- Default selection: In Progress and Completed.
-- N.B.: This filtration affects the (Total Visits) Section in the Report.
Content
Header
At the report’s header the following values are displayed as a summary for the report's data:
– Label (Total Visits): Displays the total Number of visits within the selected date range.
– Label (Total Procedures): Displays the total Number of procedures within the selected date range.
– Label (Total Fees): Displays the total Number of fees within the selected date range.
Body
Report's body displays data in 3 sections which are:
1- Total Visits
- This Section displays data for the Selected Branch from the navigation bar within the selected date range and Visit status.
- Data displayed is the total number of visits for each provider in the selected branch depending on the Creation date of the visit.
2- Total Procedures
- This Section displays the count of all procedures over the Clinic (For All branches) within the selected date range and procedure status.
- Data displayed is the total number of Procedures performed by each provider in the Clinic depending on the Creation date of the Procedure.
- Table displays the name of provider and count of total procedures performed by him/her, as the Pie Chart and Horizontal Bar chart displays data of each provider with different color.
3- Total Fees
- This Section displays the total fees of procedures all over the Clinic (All branches) within the selected date range and procedure status.
- Data displayed is the total Fees of procedures performed by each provider in the Clinic depending on the Creation date of the Procedure.
- Table displays the name of provider and total fees of procedures performed by him/her, as the Pie Chart and Horizontal Bar chart displays data of each provider with different color.