Introduction
Operatory Production Report:
- Displays the count of all visits (Regardless the Visit's Status) reserved for each operatory exist in the selected branch from the navigation bar within selected date range.
- Count of Visits taken in consideration for the displayed data in report based on the Creation date of the visit (Appointment) within the selected date range.
- Report displays Data of Last Month by default.
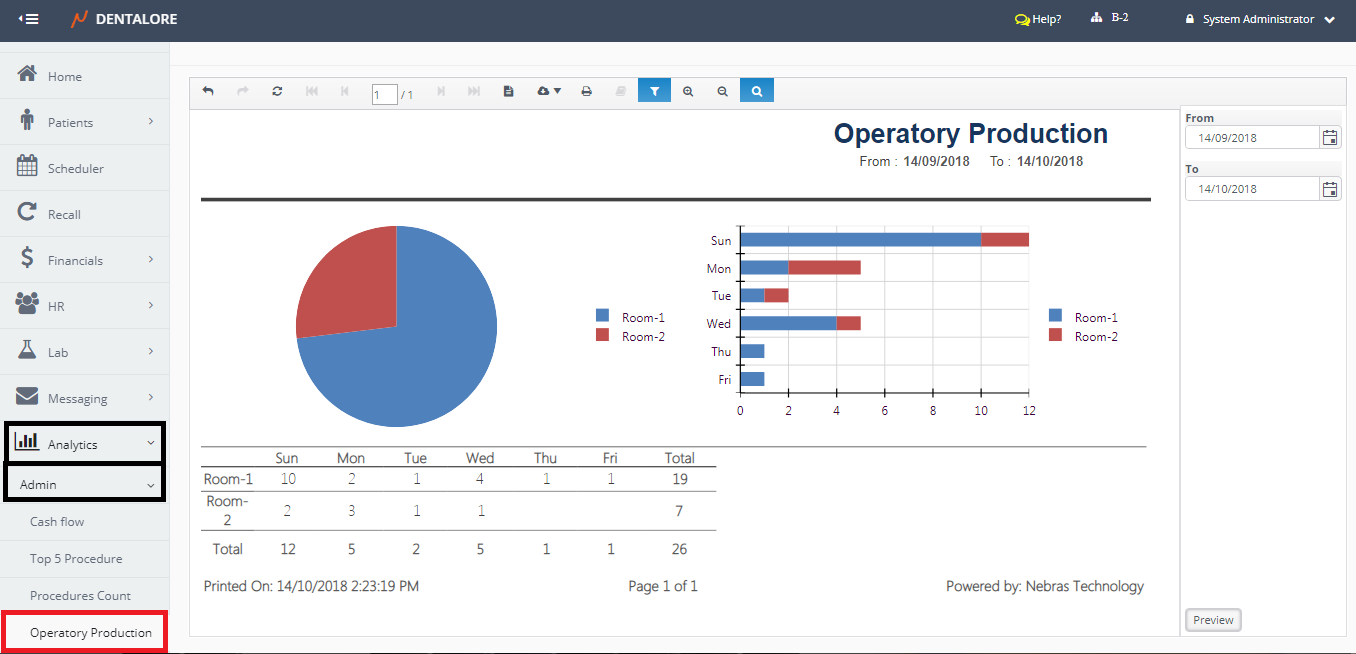
- Report displays Data in different formats: Pie Chart, Bar Chart and Table.
(Operatory Production) report could be accessed from:
- Analytics >> Admin >> Operatory Production.
Filtration
User has the ability to filter data within required period of time from:
- Date Range
- (From) and (To) fields in the filtration Area.
Content
Operatory Production displays data in:
-- Pie Chart displays the Operatories created in the selected branch that have visits, each operatory is displayed in different color.
-- Horizontal Bar Chart displays the the count of visits (Appointments) vs. the day when they had created in each operatory in the selected branch within the selected date range. Each Room displayed with different color.
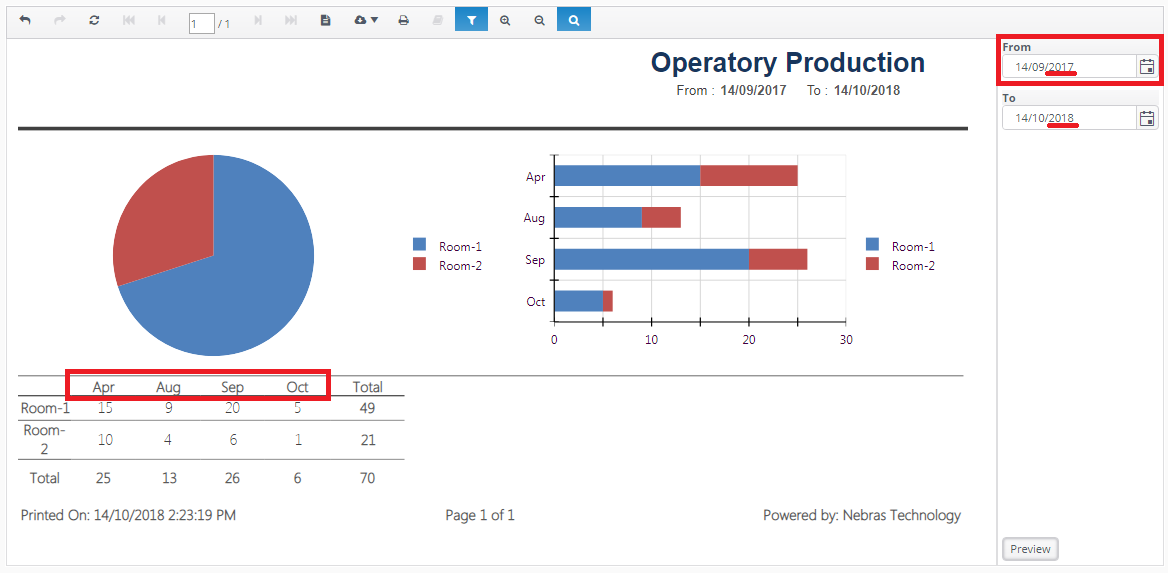
-- Table displays the Operatories created in the selected branch that have visits, Count of visits per week days, Total count of visits in the Operatory and Total count of all visits per day.
>> Note that: If the Selected Date range is by years, then the table will display (Months of Year) instead of the (Days of Week),as shown: