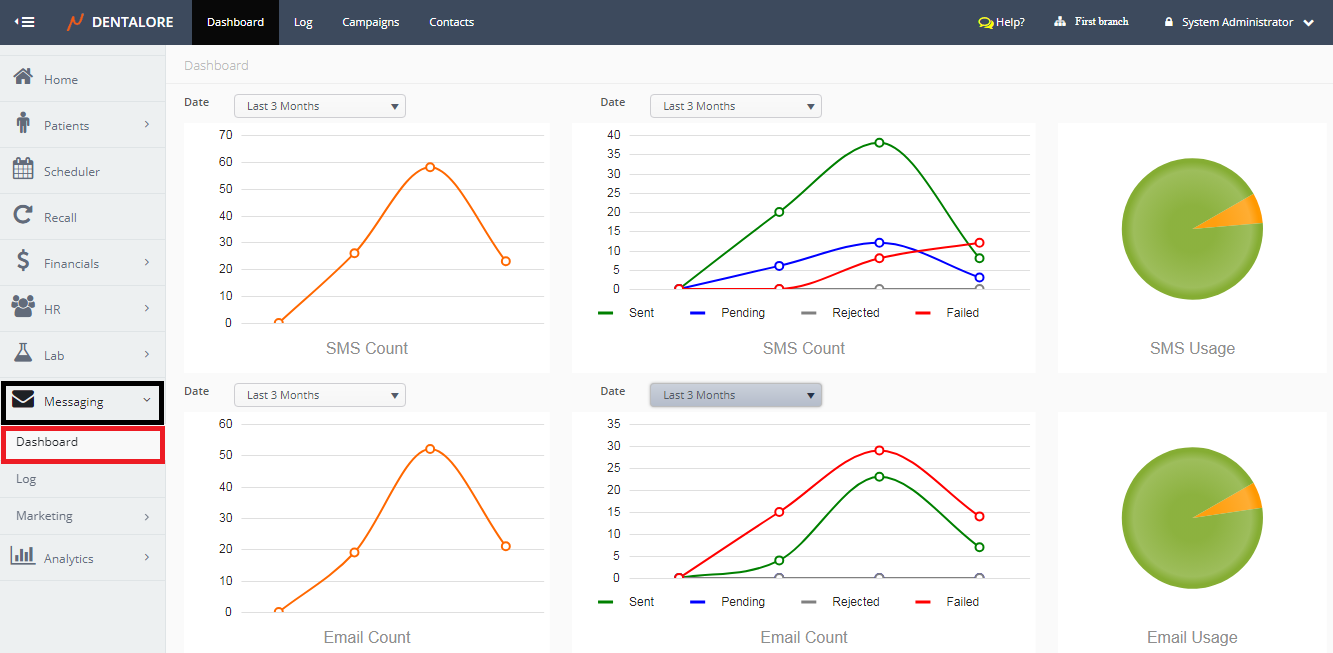
Messaging Dashboard is the View that enables user to trace the usage of his messages (SMS and Email) via graphs and pie charts.
Messaging Dashboard
- Expand Messaging menu then select "Dashboard".
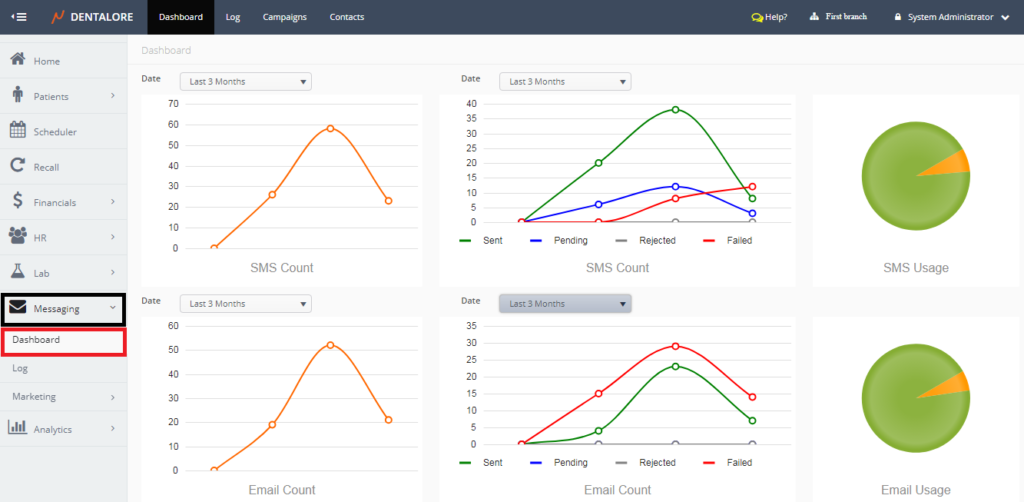
- User has the ability to display the count and different statuses (Sent, Pending, Rejected, or Failed) of SMS and Email within different periods.
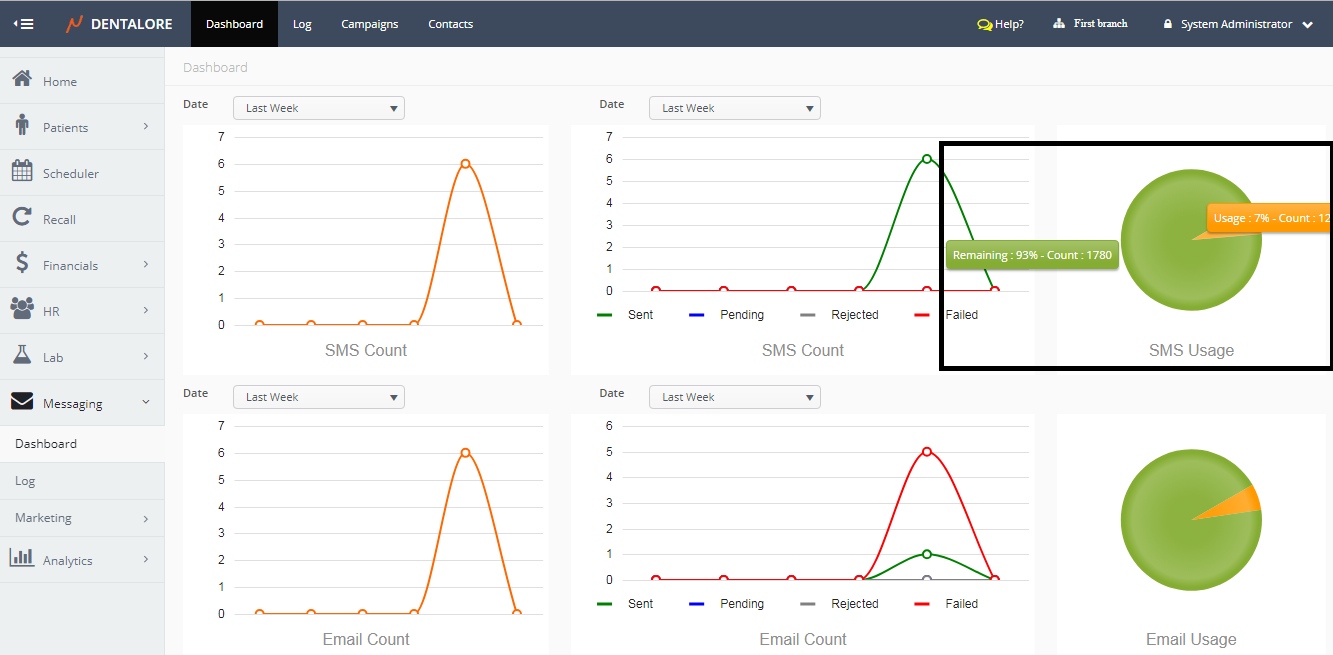
- Default Selection: Last Week.
- Each node on the shown curves once user hover over it, it displays the count of SMS on the selected date, as well the count of each of the sent, pending, rejected, and failed messages is displayed on the other graph. - 2 Pie charts displays the usage of SMS and Email that once user hover over each part in the pie chart, the usage count and percentage are displayed.

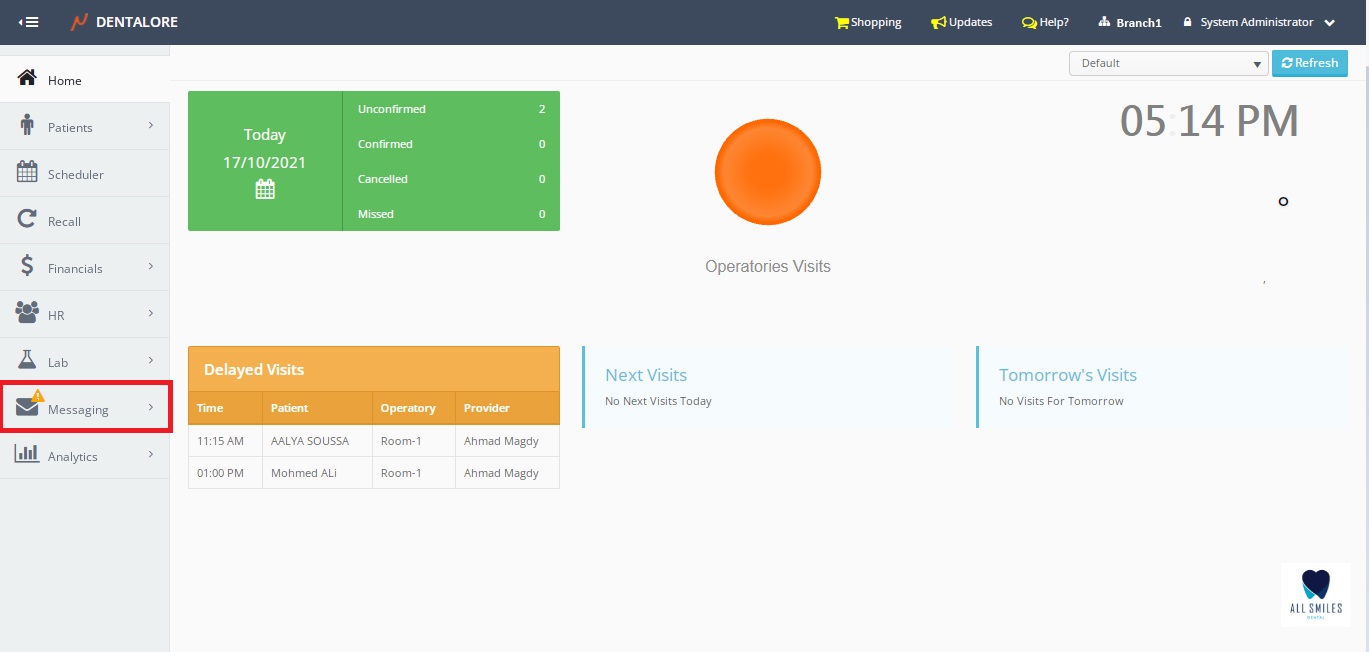
- An alert icon is displayed on 'Messaging' section to notify users whenever your SMS, Email or both Quotas are 10% or less.