
Introduction
Cash Flow Report:
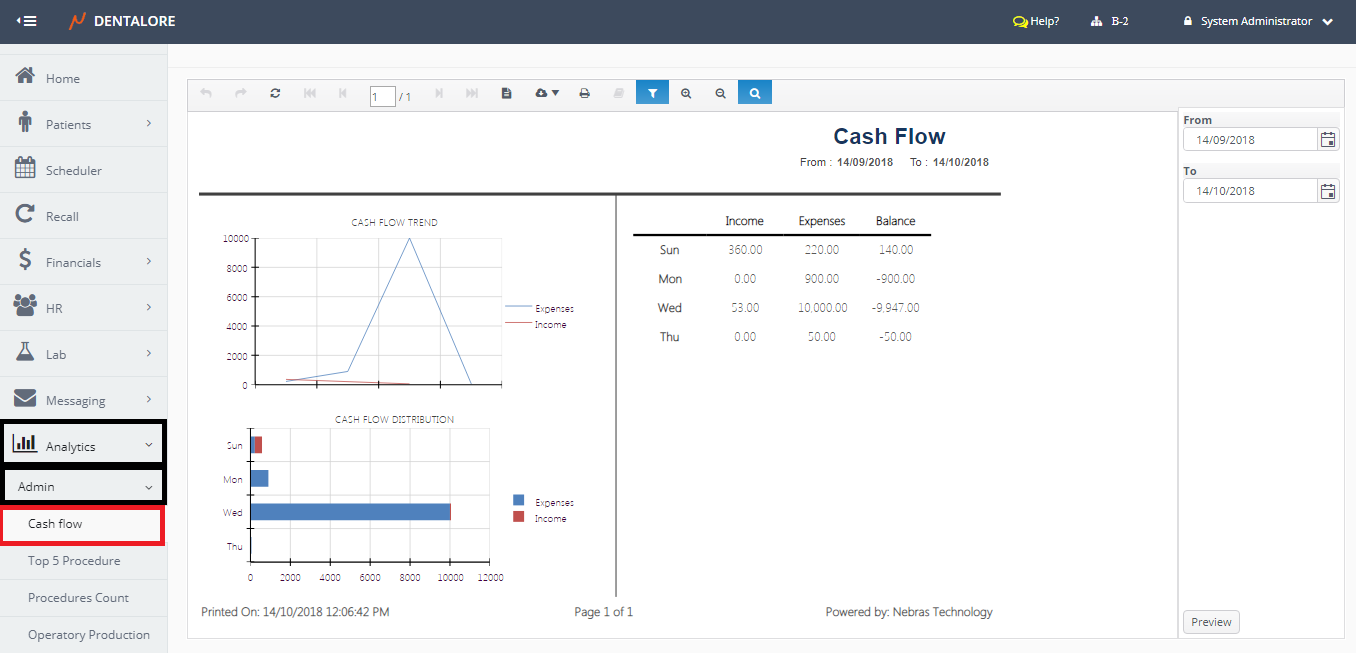
- Displays the financial info of Cash Flow, Expenses and the Balance for the selected branch from the navigation bar.
-- N.B.: Balance is the difference between Income and Expenses. - Report displays Financial Data of Last Month by default.
- Data displayed in the report depends on the Date of payment (Income and Expenses).
-- N.B.: Income includes both the payments of the patient and the Insurance regardless the status of the procedure. - Report displays Data in different formats: Graphs and Table.
(Cash Flow) report could be accessed from:
- Analytics >> Admin >> Cash Flow.
Filtration
User has the ability to filter data within required period of time from:
- Date Range
- (From) and (To) fields in the filtration Area.
Content
- Data displayed in the table are for the total (Income, Expenses, and Balance) for all (Sundays, Mondays, Tuesday, Wednesdays, Thursdays and Fridays) exist within the selected date range.
- Cash Flow Trend graph displays the Income and Expenses money value.
- Cash Flow Distribution graph displays the Income and Expenses money Value vs. day.