
Introduction
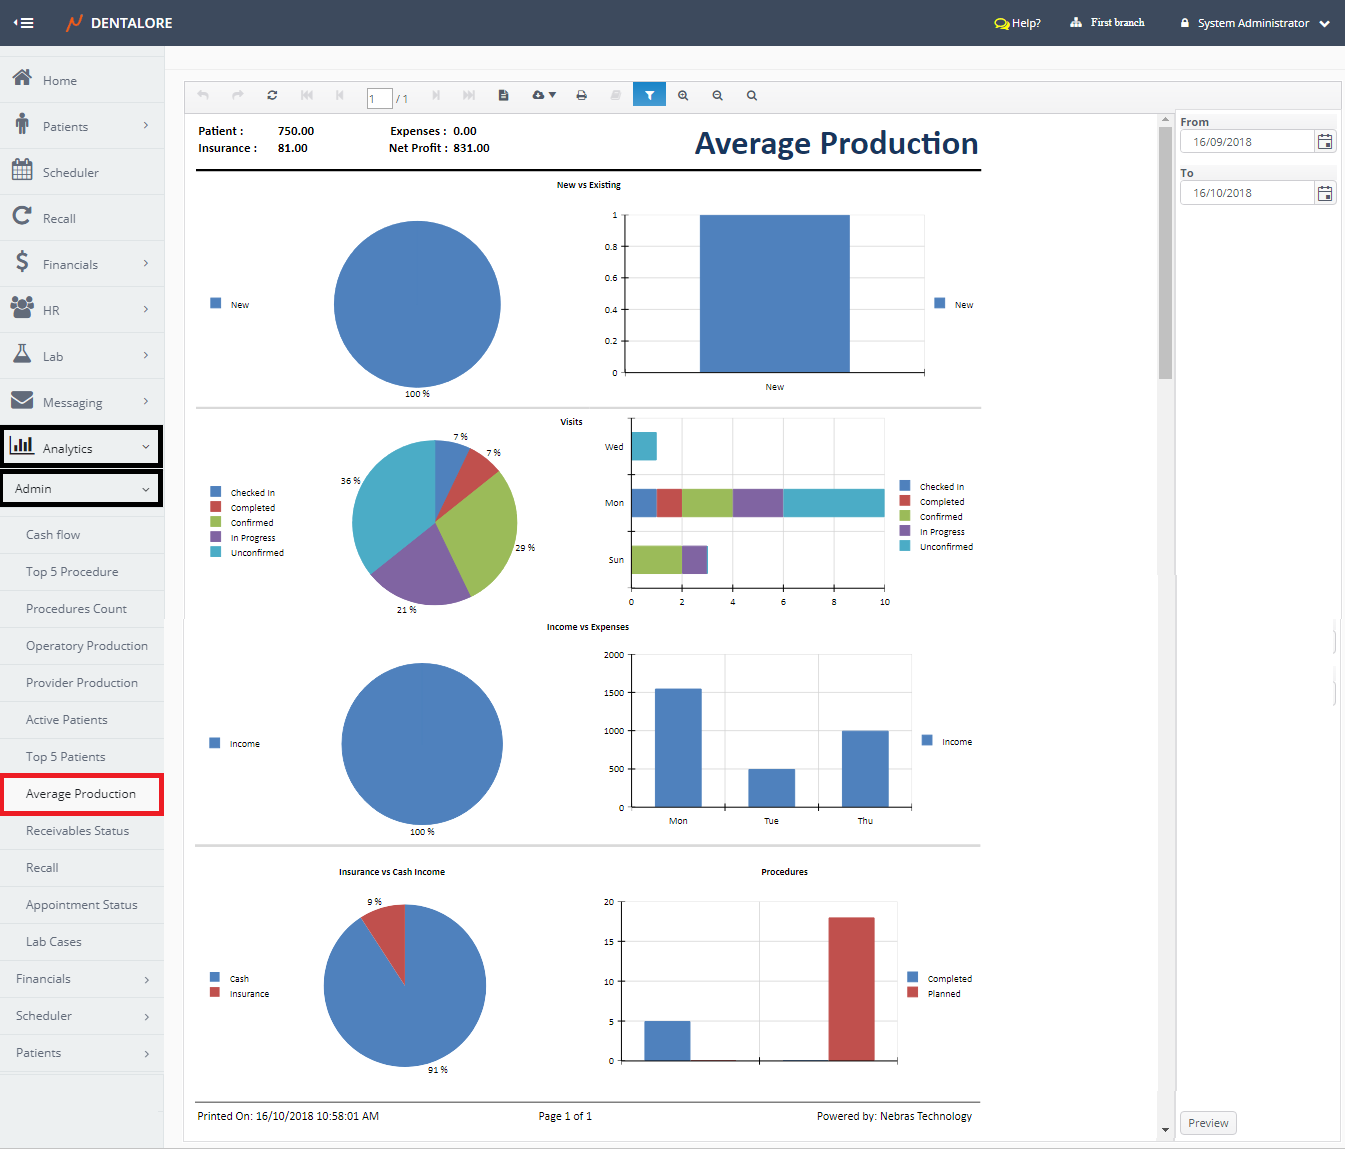
Average Production Report:
- Displays the clinic's production within a specific period of time.
- Displays the data All over the Clinic (In All Branches) within a selected date range.
- Displays Data over the Last Month by default.
- Info of patients displayed in report are divided in to 5 Sections: (New Vs Existing, Visits, Income Vs Expenses, Insurance Vs Cash Income and Procedures).
(Average Production) report could be accessed from:
- Analytics >> Admin >> Average Production.
Filtration
User has the ability to filter data within required period of time from:
- Date Range
- (From) and (To) fields in the filtration Area.
Content
Header
At the report's header the following values are displayed:
- Label (Patient): Displays All of the Actual Payments Performed by Patients in Cash for any procedure within the selected date range.
- Label (Insurance): Displays All of the Actual Payments Performed by Insurance for any procedure within the selected date range.
- Label (Expenses): Displays the clinic's Expenses within the selected date range.
- Label (Net Profit): Displays the total value of Actual Payment (For Cash and Insurance) - Total Expenses within the selected date range.
>> Note that the Actual payments performed for all procedures status (Planned, In Progress and completed) all are taken in consideration while calculating the above values.
Body
Average Production displays the following data in the following sections:
1- New Vs Existing
- Section displays the Count of new and existing Patients who have completed at least one visit within the selected date range. Data displayed in a Pie Chart and a Horizontal Bar Chart.
- New Patients are patients who Don't have a Completed Visit before the selected date range.
- Exiting Patients are patients who have a Completed Visit before the selected date range.
- Note that patients' visit taken in consideration in this section are the visits of Completed Status Only.
2- Visits
- Section displays the count of all visits (Appointments) with all status: (Unconfirmed, Confirmed, Checked In, Delayed, In Progress, Completed, Checked Out, Missed and Cancelled) for all patients (New and Existing) in a Pie chart and a horizontal bar chart in which each status has a different color.
>> Note that: If the Selected Date range is by months, then the table will display (Months of Year) instead of the (Days of Week).
3- Income Vs Expenses
- Pie Chart and Bar Chart displays the Total Income and Total Expenses within the selected date range.
>> Note that: In Bar Chart If the Selected Date range is by months, then the table will display (Months of Year) instead of the (Days of Week).
4- Insurance Vs Cash Income
- Pie Chart displays the Total Fees of any (Completed and In Progress) Procedure related to Insurance and Cash patients (New and Existing) within the selected date range.
- Completed Procedures: displayed if "Completion Date" is within the date range selection.
- In Progress Procedures: displayed if the "Started Date" is within the date range selection.
5- Procedures
- Section displays the count of all procedures with status: (Planned, In Progress and Completed) for all patients (New and Existing) in a Vertical Bar chart in which each status has a different color.
- Note that Procedures are displayed according to their Creation date.