
Introduction
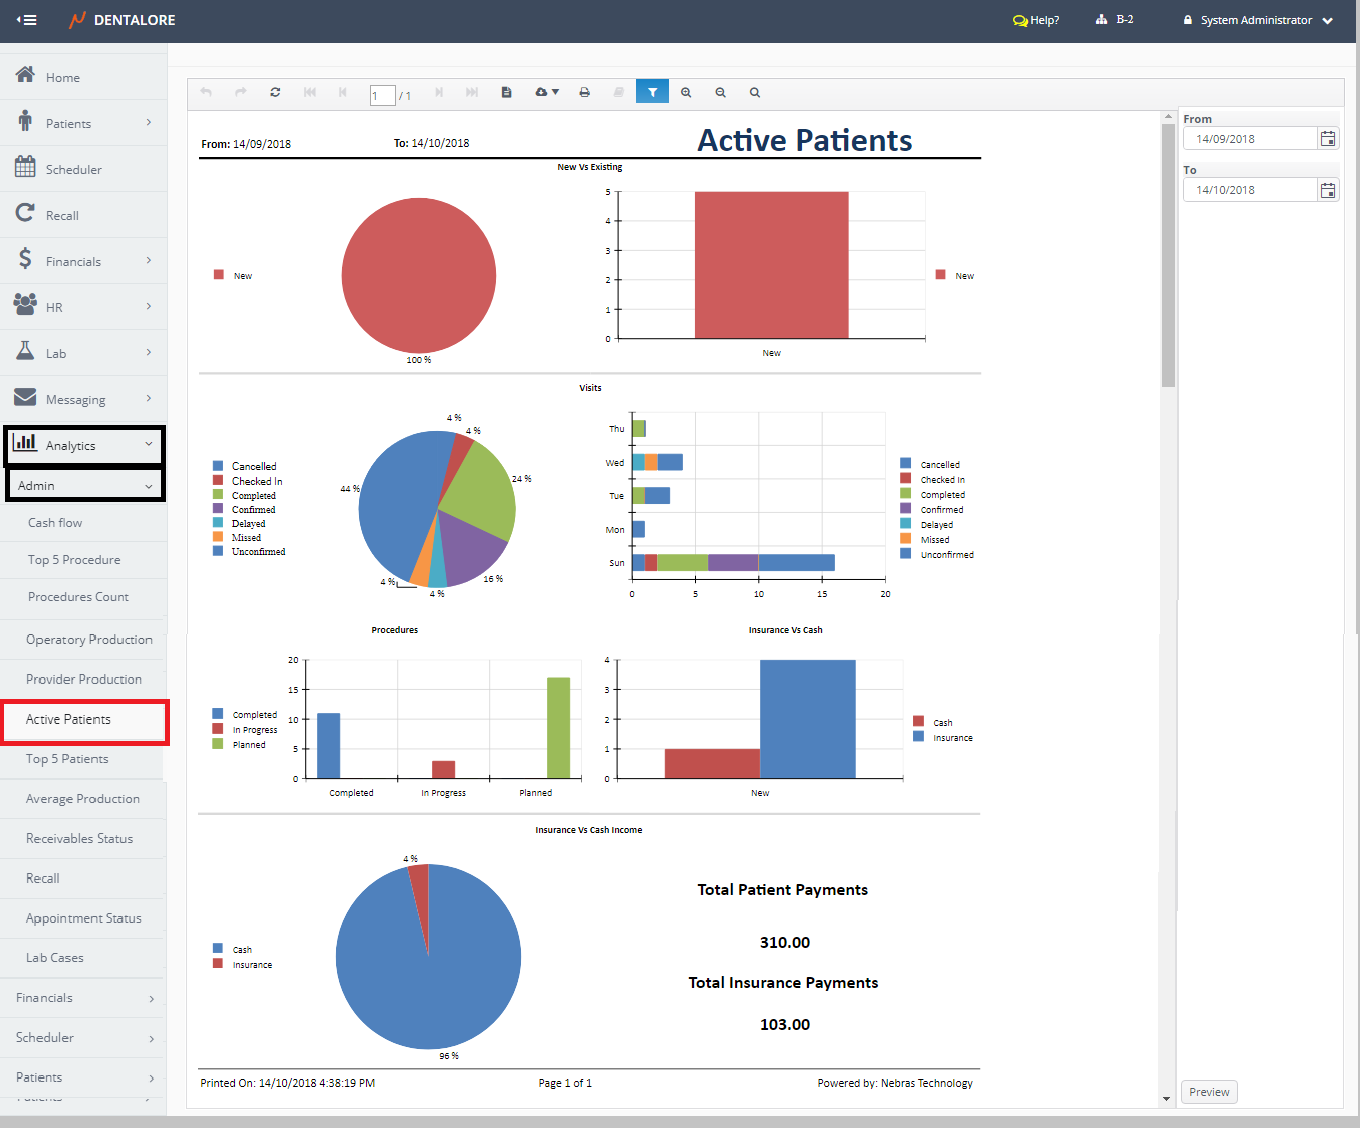
Active Patients Report:
- Includes the new and existing patients' types in which:
- New Patients are patients who Don't have a Completed Visit before the selected date range.
- Exiting Patients are patients who have a Completed Visit before the selected date range. - Report displays Info of patients within selected date range all over the Clinic level (For all branches).
- Report displays Data over the Last Month by default.
- Info of patients displayed in report are divided in to 5 Sections: (New Vs Existing, Visits, Procedures, Insurance Vs Cash and Insurance Vs Cash Income).
(Active Patients) report could be accessed from:
- Analytics >> Admin >> Active Patients.
Filtration
User has the ability to filter data within required period of time from:
- Date Range
- (From) and (To) fields in the filtration Area.
Content
Report's body displays data in 5 sections which are:
1- New Vs Existing
- Section displays the Count of new and existing Patients who have completed at least one visit within the selected date range. Data displayed in a Pie Chart and a Horizontal Bar Chart.
- Note that patients' visit taken in consideration in this section are the visits of Completed Status Only.
2- Visits
- Section displays the count of all visits (Appointments) with all status: (Unconfirmed, Confirmed, Checked In, Delayed, In Progress, Completed, Checked Out, Missed and Cancelled) for all patients (New and Existing) in a Pie chart and a horizontal bar chart in which each status has a different color.
>> Note that: If the Selected Date range is by months, then the table will display (Months of Year) instead of the (Days of Week).
3- Procedures
- Section displays the count of all procedures with status: (Planned, In Progress and Completed) for all patients (New and Existing) in a Vertical Bar chart in which each status has a different color.
- Note that Procedures are displayed according to their Creation date.
4- Insurance Vs Cash
- Section displays the count of Insurance and Cash patients (New and Existing) who have completed at least one visit within the date range in Vertical Bar chart.
5- Insurance Vs Cash Income
- Pie Chart displays the Total Fees of any (Completed and In Progress) Procedure related to Insurance and Cash patients (New and Existing) within the selected date range.
- Completed Procedures: displayed if "Completion Date" is within the date range selection.
- In Progress Procedures: displayed if the "Started Date" is within the date range selection. - Label of (Total Patient Payments) displays All of the Actual Payments related to the Cash patients within the selected date range.
- Label of (Total Insurance Payments) displays All of the Actual Payments related to Insurance Patients within the selected date range.