
Provider Dashboard is the default view (Home) page when a provider logs in by his/her account to DentaLore.
Provider Dashboard is mainly divided in 4 sections: (Provider Visits, Patient Details, Weekly Statistics, and Monthly Statistics).
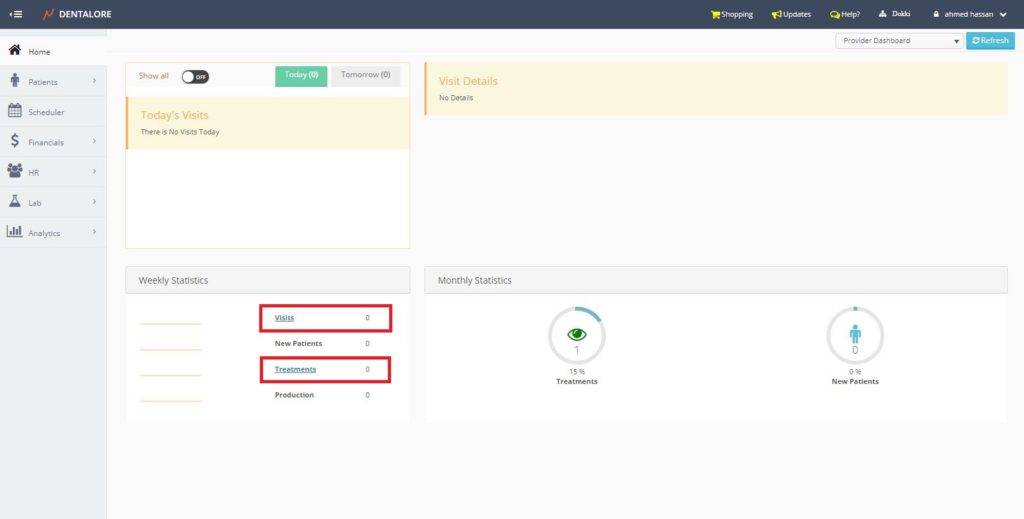
1- Provider Visits
In this section all of the provider's visits in the selected branch from navigation bar, for today and tomorrow are displayed each in separate display.
- Today
- Tab displays today's visits of all status except the missed and cancelled visits and the total number of visits.
- In order to display all visits of all statues, Change the (Show All) switch button to be: ON. - Tomorrow
- Tab displays tomorrow's visits of all status except the missed and cancelled visits and the total number of visits.
- In order to display all visits of all statues, Change the (Show All) switch button to be: ON.
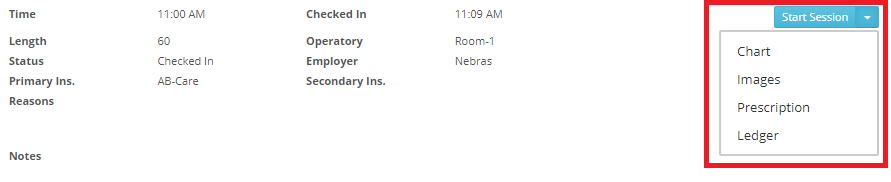
2- Patient Details
Section displays the data of selected patient from the (Provider's visits) section which are:
- Patient's Name, ID, Phone, Mobile, Email, Gender and age.
- Total number of visits of all status except missed and cancelled each is counted separately.
- Total number of missed visits.
- Total number of cancelled visits.
- Average delay time for all patient's visits.
- Details of selected visit are displayed as well.
Visit's Details are the: "Start Time, Length, Status, Checked In time, Operatory name, Employer name, Primary insurance company, Secondary insurance company, Reasons and Notes". - "Start Session" button that once pressed provider will be directed to the patient's 3D chart view in order to start working. As well if you press the "Arrow" a shortcut menu opens in order to enable provider to select required view (Chart, Images, Prescription, or Ledger) for patient.
3- Weekly Statistics
Section displays the following data:
- Visits
Hyper link displays the visits assigned to provider for all branches and it is a hyper link that directs the user to "Visits".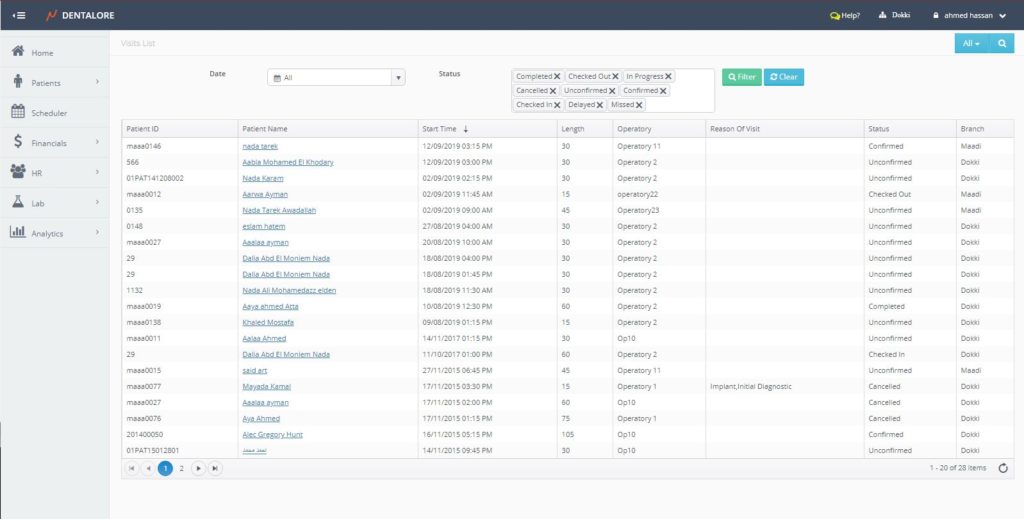
Note that visits page:
- Displays provider's visits within specific date range.
- By Default: Date is set to Current week and Status is set to Completed&Checked out
- New Patients
Displays the count of new patients came to the clinic (Registered) and have visits created for them within the current week. - Treatment
Displays Only the count of Completed procedures for all branches assigned to this provider and it is a hyper link that directs the user to "Procedures List"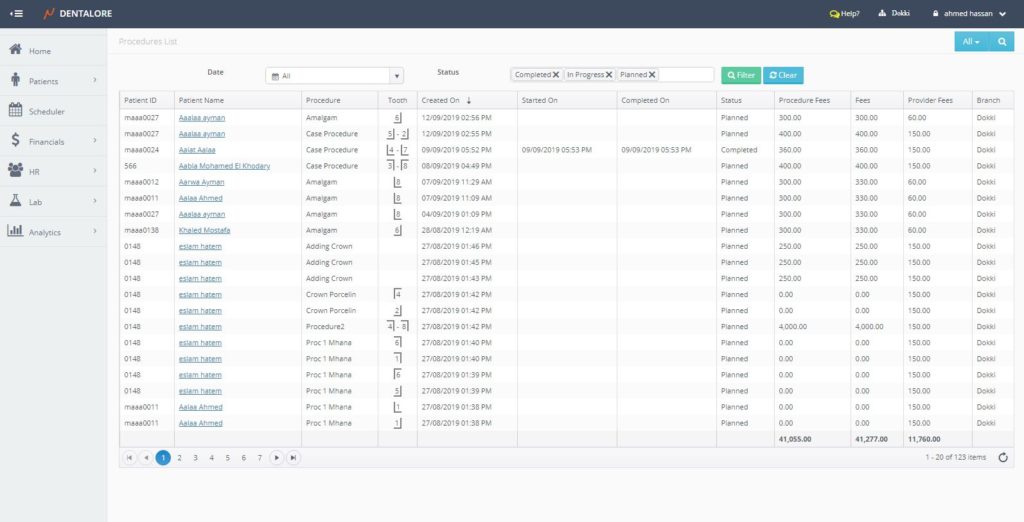
Note that Treatments page:
- Displays provider's procedures with specific date range
- By Default: Date is set to Current week and Status is set to Completed
- Production
Displays Only the production (Fees) of Completed procedures for all branches assigned to this provider.
4- Monthly Statistics
Section displays the following data:
- Treatments
Reflect data for Completed procedures only for all branches . - New Patients
Displays the count of new patients came to the clinic (Registered) and have visits created for them within the current month.